Sidiora Markets (SID) Fell 11.4%, With No Elevated Risk Indicators Detected
Price Action
During the last hour, Sidiora Markets (SID) traded between a low of $0.004622 and a high of $0.005220, with a trading volume of approximately $26,360. This price movement reflects a decline of 11.4% and indicates a relatively active trading environment, although the volume is below the threshold of $25,000 that typically raises concerns.
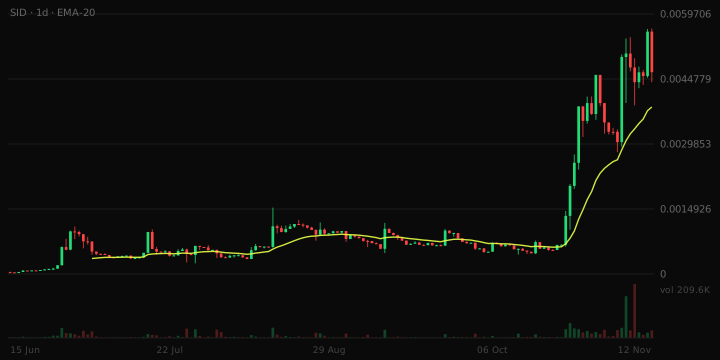
What The Risk Data Shows
Liquidity depth stands at $180,491, adequate for ordinary position sizes, though not deep. Liquidity is 3.9% of market cap, close to the 3.7% typical at this size. Order flow balance shows that 22% of the last hour's transactions were sells, indicating a buy-side leaning. The 24-hour volume is 0.3x liquidity, a normal turnover rate. The overall risk band is categorized as Low.
Trading Activity
In the last hour, there were 91 buy transactions and 26 sell transactions, resulting in a buy-sell ratio of approximately 3.5:1.
Market Snapshot
- Price (USD): $0.004622
- Liquidity (USD): $180,491
- Market Cap (USD): $4,575,938
- 1-hour Price Change: -11.41%
- 24-hour Price Change: -3.03%
- 24-hour Volume (USD): $47,760
- Pair Age: 290 days
Why This Was Flagged
- Price moved 11.4% in one hour (threshold: 15%)
- One-hour volume of $26,360 (threshold: $25,000)
- 117 trades in the last hour (threshold: 100)
- $180,491 of liquidity (threshold: $50,000)
- $4,575,938 market cap (threshold: $250,000)
- Trading pair 290 days old (threshold: 15 minutes)
Risk Note
This article is not financial advice.