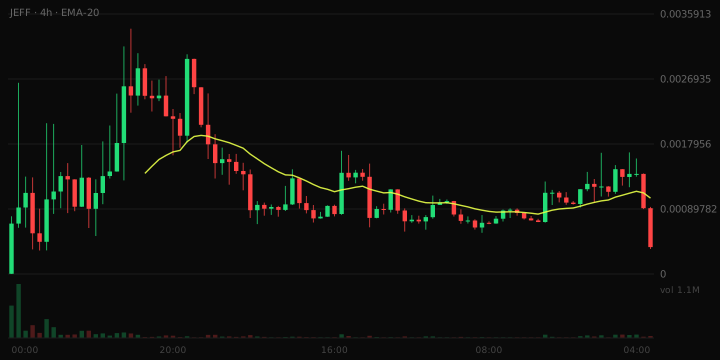
Jeff (JEFF) Slides 61.6% but Only $54,602 of Liquidity Backs It, So Exits Move the Price Sharply
Volatility Event
During the last hour, the price of jeff (JEFF) fluctuated between $0.0003668 and a lower bound that reflects the sharp decline, resulting in a significant turnover. The liquidity backing this token was recorded at $54,602, indicating that while small trades can be executed relatively easily, larger trades will likely cause more pronounced price movements. The price change of 61.6% underscores the volatility present in this trading environment.
- Liquidity depth: $54,602
What The Risk Data Shows
The strongest contributor to the risk assessment is liquidity depth: $54,602 of liquidity. Workable for small positions, but larger orders will move the price against you. The 24h volume is 7.4x liquidity — active trading relative to pool depth. Liquidity is 14.9% of market cap, close to the 15.9% typical at this size. The overall risk band is Moderate.
Trading Conditions
In the last hour, there were 279 buy transactions compared to 135 sell transactions, indicating a buy-side leaning. This balance suggests that demand may be supporting the price despite the recent decline.
Liquidity Context
The raw liquidity figure stands at $54,602, which implies that the market may experience significant price shifts with larger trades. The depth of liquidity is critical for understanding potential price impacts during trading.
Why This Was Flagged
- Price moved 61.6% in one hour (threshold: 15%)
- One-hour volume of $44,333 (threshold: $25,000)
- 414 trades in the last hour (threshold: 100)
- $54,602 of liquidity (threshold: $50,000)
- $366,801 market cap (threshold: $250,000)
- Trading pair 15 days old (threshold: 15 minutes)
Risk Note
This article is not financial advice.