FOBO (FOBO) Fell 27.0%, With No Elevated Risk Indicators Detected
Volatility Event
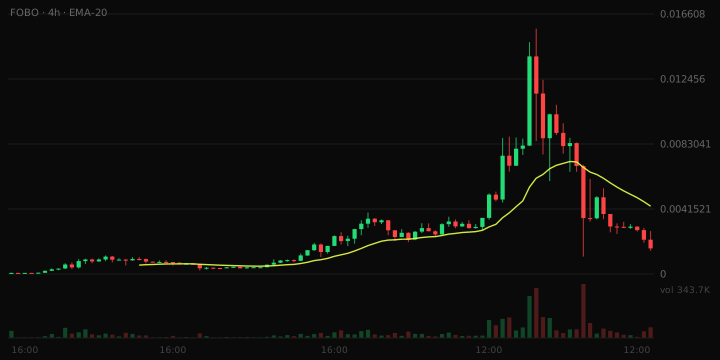
The trading range for FOBO over the past hour was between $0.001631, with a total of 225 transactions recorded. The turnover was approximately $39,582, indicating a relatively orderly move despite the significant price change of 27.0%. This hour's trading activity shows a notable shift compared to previous periods.
What The Risk Data Shows
40% of the last hour's 225 transactions were sells, roughly balanced. The pair is 16 days old, with an established trading history. There is $1,195,825 of liquidity, deep enough to absorb orders of typical size. 24h volume is 0.2x liquidity, a normal turnover rate. The overall risk band is Low.
Trading Conditions
In the last hour, there were 134 buys and 91 sells, indicating a balanced trading environment with no clear dominance from either side.
Liquidity Context
The liquidity figure stands at $1,195,825, which implies sufficient depth to handle typical order sizes without significant slippage.
Why This Was Flagged
- Price moved 27.0% in one hour (threshold: 15%)
- One-hour volume of $39,582 (threshold: $25,000)
- 225 trades in the last hour (threshold: 100)
- $1,195,825 of liquidity (threshold: $50,000)
- $1,618,308 market cap (threshold: $250,000)
- Trading pair 16 days old (threshold: 15 minutes)
Risk Note
This article is not financial advice.