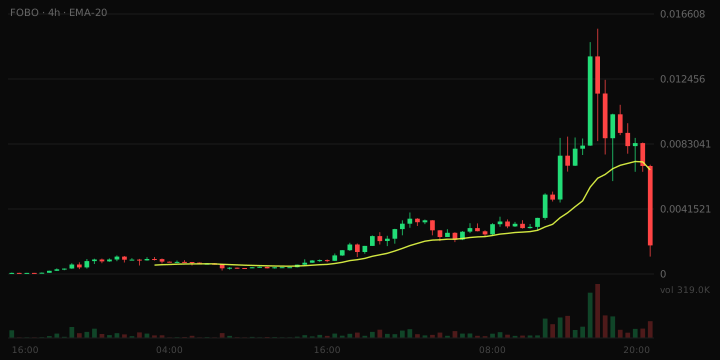
FOBO (FOBO) Fell 73.5%, With No Elevated Risk Indicators Detected
Volatility Event
FOBO experienced a significant price drop, trading between $0.001977 and a low of approximately $0.000525 over the hour, with a total turnover of $214,909. This indicates a relatively orderly move given the volume of trades, with 524 transactions recorded during this period.
What The Risk Data Shows
46% of the last hour's 524 transactions were sells, roughly balanced. The pair is 14 days old, with an established trading history. There is $1,422,241 of liquidity, which is deep enough to absorb orders of typical size. The 24-hour volume is 0.4x liquidity, a normal turnover rate. The overall risk band is classified as Low.
Trading Conditions
In the last hour, there were 283 buys and 241 sells, indicating a balanced trading environment with neither side leading. This suggests that market participants are evenly matched in their trading activities.
Liquidity Context
The liquidity figure stands at $1,422,241, which implies sufficient depth to accommodate typical order sizes without significant price impact. This level of liquidity is above the threshold typically observed for assets of this market cap size.
Why This Was Flagged
- Price moved 73.5% in one hour (threshold: 15%)
- One-hour volume of $214,909 (threshold: $25,000)
- 524 trades in the last hour (threshold: 100)
- $1,422,241 of liquidity (threshold: $50,000)
- $1,970,948 market cap (threshold: $250,000)
- Trading pair 14 days old (threshold: 15 minutes)
Risk Note
This article is not financial advice.