Hallow Inu (HI) Drops 22.5% on Turnover of 16.4x Its Pool Depth
Volatility Event
Hallow Inu (HI) traded between $0.0003826 and a lower bound that was not specified, with a turnover of approximately $51769.91 over the last hour. This represents a significant movement of 22.5% within that timeframe, indicating a high level of activity and potential disorder in the market.
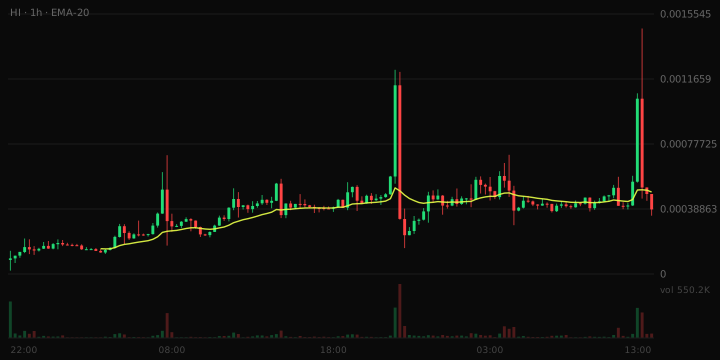
- Volume vs liquidity: 16.4x
- Liquidity depth: $65,609
What The Risk Data Shows
24h volume is 16.4x the pool's liquidity. The same liquidity is being turned over repeatedly, which can indicate wash trading or bot activity. The overall risk band is Moderate. Liquidity is 17.6% of market cap, close to the 15.8% typical at this size.
Trading Conditions
In the last hour, there were 622 buys and 461 sells, resulting in a roughly balanced order flow. This indicates a relatively stable trading environment despite the volatility.
Liquidity Context
The liquidity figure stands at $65,609, which is workable for small positions but suggests that larger orders may move the price against traders. This level of liquidity reflects a moderate depth in the market.
Why This Was Flagged
- Price moved 22.5% in one hour (threshold: 15%)
- One-hour volume of $51,770 (threshold: $25,000)
- 1,083 trades in the last hour (threshold: 100)
- $65,609 of liquidity (threshold: $50,000)
- $373,114 market cap (threshold: $250,000)
- Trading pair 6 days old (threshold: 15 minutes)
Risk Note
This article does not constitute financial advice.