Abu Shalab (ABU) Fell 21.3% as Volume Runs 12.1x Its Liquidity, a Pattern Consistent With Wash Trading
Volatility Event
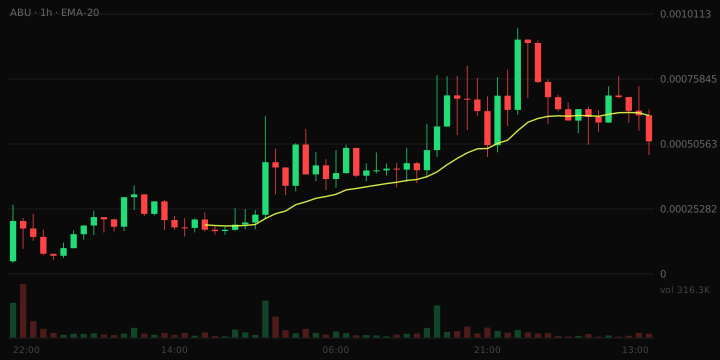
Abu Shalab (ABU) experienced a price decline, trading between $0.0005225 and a peak of $0.0006630 within the hour. The turnover during this period reached $29,192, indicating a relatively active trading environment, although the significant price drop of 21.3% suggests potential instability.
- Volume vs liquidity: 12.1x
- Liquidity depth: $72,103
- Pair maturity: 2.6 days
What The Risk Data Shows
The strongest contributor to the risk assessment is that 24h volume is 12.1x liquidity — active trading relative to pool depth. Overall, the risk band is Moderate. The liquidity depth stands at $72,103, which is workable for small positions, but larger orders will move the price against you. The trading pair is 2.6 days old — past the riskiest window but still young.
Trading Conditions
In the last hour, there were 105 buy transactions and 82 sell transactions, indicating a roughly balanced order flow. This balance suggests that market participants are actively engaging with the asset despite the recent price decline.
Liquidity Context
The liquidity figure is $72,102.74, implying that while it is sufficient for smaller trades, larger trades may significantly impact the price. The liquidity is 14.3% of the market cap, which is close to the typical ratio for assets of this size.
Why This Was Flagged
- Price moved 21.3% in one hour (threshold: 15%)
- One-hour volume of $29,192 (threshold: $25,000)
- 187 trades in the last hour (threshold: 100)
- $72,103 of liquidity (threshold: $50,000)
- $504,753 market cap (threshold: $250,000)
- Trading pair 3 days old (threshold: 15 minutes)
Risk Note
This article does not constitute financial advice.