This token's liquidity has fallen substantially since publication, to approximately $7,330. That is down 94% from the $112,973 reported when this article was published. The figures below describe conditions at the time of writing.
SuerMarioBrosCoin (MARIO) Records Elevated Volume Relative to Market Cap on Robinhood
Risk Overview
SuerMarioBrosCoin (MARIO) presents an elevated risk profile, primarily due to its significant volume relative to liquidity. The current risk level indicates potential concerns regarding trading dynamics and market stability.
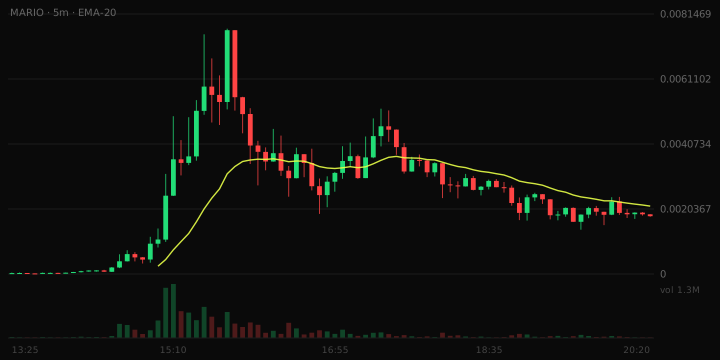
- Volume vs liquidity: 122.1x
- Pair maturity: 7.0 hours
Liquidity Assessment
The raw liquidity figure stands at $112,973. Liquidity is 6.6% of market cap, close to the 6.4% typical at this size. This liquidity is adequate for ordinary position sizes, though not deep.
Volume Assessment
The 24-hour trading volume is reported at $13,797,365. The 24h volume is 122.1x the pool's liquidity. The same liquidity is being turned over repeatedly, which can indicate wash trading or bot activity.
Trading Behaviour
In the last hour, there were 785 buy transactions and 732 sell transactions, resulting in a buy/sell ratio of approximately 1.07. Transaction-level buy/sell data was not available.
Risk Note
This article is for informational purposes only and does not constitute financial advice.