Infinite Money Glitch (GLITCH) Fell 15.9% While Sell Orders Dominate the Flow
Volatility Event
During the last hour, the price of Infinite Money Glitch (GLITCH) traded between $0.003813 and $0.003213, with a total turnover of approximately $33,222. This indicates a significant level of trading activity, with 380 transactions recorded in that timeframe, reflecting a relatively orderly market despite the notable price decline of 15.9%.
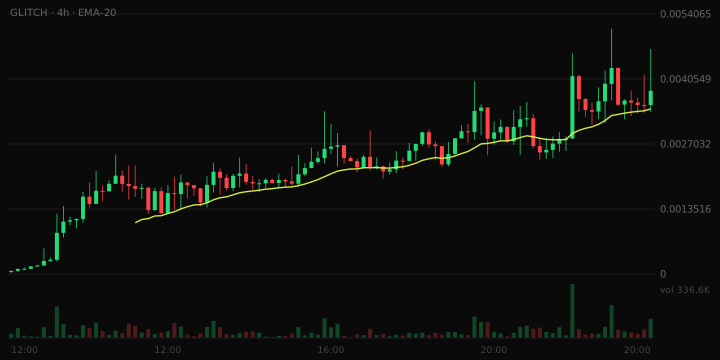
- Order flow balance: 63% sells
What The Risk Data Shows
63% of the last hour's 380 transactions were sells. Sell-side pressure dominates. The overall risk band is Moderate, with an overall score of 33.2. Liquidity is $170,429, adequate for ordinary position sizes, though not deep.
Trading Conditions
In the last hour, there were 142 buy transactions compared to 238 sell transactions. This imbalance indicates a prevailing bearish sentiment among traders.
Liquidity Context
The liquidity figure stands at $170,429, which implies adequate depth for typical trades, though it may not support larger trades without significant price impact.
Why This Was Flagged
- Price moved 15.9% in one hour (threshold: 15%)
- One-hour volume of $33,222 (threshold: $25,000)
- 380 trades in the last hour (threshold: 100)
- $170,429 of liquidity (threshold: $50,000)
- $3,553,942 market cap (threshold: $250,000)
- Trading pair 16 days old (threshold: 15 minutes)
Risk Note
This article is not financial advice.