BTC$77,213▼ 0.39%
ETH$2,116▼ 0.78%
SOL$85.65▲ 0.78%
HYPE$57.73▲ 15.29%
XRP$1.36▼ 0.53%
BNB$649.20▲ 0.73%
DOGE$0.1045▲ 0.50%
AVAX$9.31▲ 0.70%
LINK$9.58▼ 0.12%
TAO$278.80▲ 5.59%
ZEC$661.59▲ 13.74%
NEAR$1.76▲ 7.73%
BTC$77,213▼ 0.39%
ETH$2,116▼ 0.78%
SOL$85.65▲ 0.78%
HYPE$57.73▲ 15.29%
XRP$1.36▼ 0.53%
BNB$649.20▲ 0.73%
DOGE$0.1045▲ 0.50%
AVAX$9.31▲ 0.70%
LINK$9.58▼ 0.12%
TAO$278.80▲ 5.59%
ZEC$661.59▲ 13.74%
NEAR$1.76▲ 7.73%
RSS
Risk Alert· Risk Alert ·

The McRib Indicator (MCRIB) Records Elevated Volume Relative to Market Cap on Solana

Risk Overview

The McRib Indicator (MCRIB) presents an elevated risk level, primarily due to its nascent trading pair, which is only 1.1 hours old. This limited trading history raises concerns about potential volatility and unforeseen market dynamics.
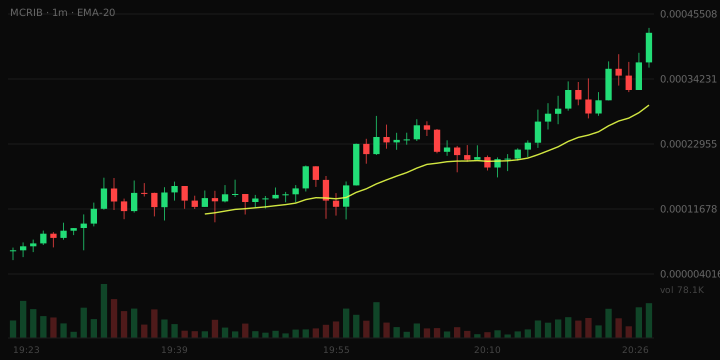
MCRIB price chart, 64 candles to Oct 22, 2026
TA · Uptrend — price above EMA-20 and EMA-50 · RSI 73 (overbought) · near the top of its range · 1h +425% on $1.4M vol · 1h flow 54% buy / 46% sell · liquidity $56k · pool 64m old
Snapshot captured · View live chart →
Scalper risk score 53/100 Elevated
Elevated risk (53/100). The strongest contributor is pair maturity: The pair is 1.1 hours old. Most catastrophic failures happen in the first day, and there is no trading history to assess. Assessed on 7 of 8 components; holder concentration unavailable.
Market readEvery price this token has traded at was set in the last 1.1 hours, so there is no prior range to measure the current one against.
  • Pair maturity: 1.1 hours
  • Volume vs liquidity: 24.8x
  • Liquidity depth: $56,021
7 of 8 components assessed · partial confidence · GoPlus + RugCheck
Full risk assessment and coverage for MCRIB →

Liquidity Assessment

The liquidity for MCRIB stands at $56,021. Liquidity is 14.9% of market cap, close to the 15.7% typical at this size. While this liquidity is workable for small positions, larger orders will move the price against you.

Volume Assessment

The 24-hour trading volume for MCRIB is $1,391,173. The 24h volume is 24.8x the pool's liquidity. The same liquidity is being turned over repeatedly, which can indicate wash trading or bot activity.

Trading Behaviour

In the last hour, there were 13,075 buys and 11,270 sells, resulting in a buy/sell ratio of approximately 1.16. Transaction-level buy/sell data was not available.

Risk Note

This article is not financial advice.