Super Inu Force (SIF) Has Had 54% of Its Liquidity Withdrawn in Under an Hour
What Changed
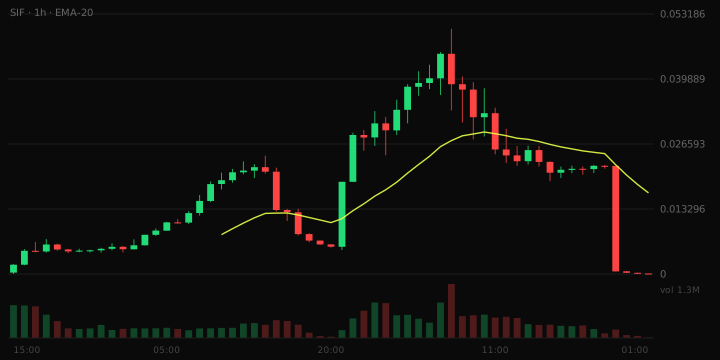
In a significant liquidity event, Super Inu Force (SIF) experienced a withdrawal of $37,856.32 from its liquidity pool, dropping from $69,458.37 to $31,602.05 within a window of approximately 59.9 minutes.
What This Means For Trading
With the current liquidity now at $31,602.05, the remaining depth may impact traders attempting to exit positions. A thinner pool can lead to increased slippage, meaning that larger trades may have a more pronounced effect on the available liquidity, potentially resulting in less favorable execution prices.
Our Earlier Coverage
In our previous coverage published on October 5, 2026, titled "Super Inu Force (SIF) Gains 25.4% as Volume Runs 11.4x Its Liquidity, a Pattern Consistent With Wash Trading," we flagged the token's liquidity dynamics and trading patterns.
Current State
- Liquidity Before: $69,458.37
- Liquidity Now: $31,602.05
- Window Minutes: 59.9
- Liquidity at Publication: $554,256.72
Risk Note
This article does not constitute financial advice.