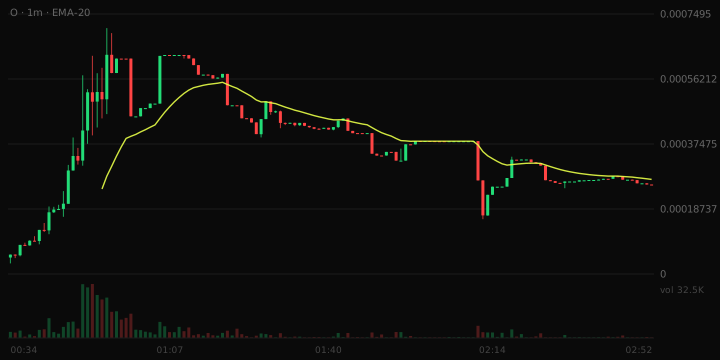
O (O) Fell 42.9% on a 1.6 Hours-old Pool With No Track Record to Assess
Volatility Event
The price of O traded between $0.0003808 and an undefined lower limit, resulting in a significant turnover of $80,754 over the last hour. This movement occurred in a newly established trading pair that is only 1.6 hours old, indicating a lack of historical price data to provide context for this volatility.
- Pair maturity: 1.6 hours
- Order flow balance: 69% sells
- Contract control: 1 concern(s)
What The Risk Data Shows
The pair is 1.6 hours old. Most catastrophic failures happen in the first day, and there is no trading history to assess. 69% of the last hour's 1,000 transactions were sells. Sell-side pressure dominates. The overall risk band is Moderate.
Trading Conditions
In the last hour, there were 313 buy transactions compared to 687 sell transactions, indicating a strong sell-side pressure. This imbalance suggests that market sentiment is leaning towards selling.
Liquidity Context
The liquidity figure stands at $290,670, which is adequate for ordinary position sizes but not deep. This level of liquidity implies that larger trades may experience slippage.
Why This Was Flagged
- Price moved 42.9% in one hour (threshold: 15%)
- One-hour volume of $80,754 (threshold: $25,000)
- 1,000 trades in the last hour (threshold: 100)
- $290,670 of liquidity (threshold: $50,000)
- $380,825 market cap (threshold: $250,000)
- Trading pair 1.6 hours old (threshold: 15 minutes)
Risk Note
This article does not constitute financial advice.