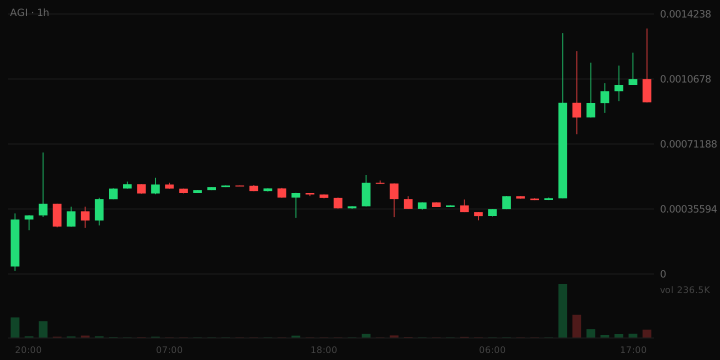
Alphabet Inu (AGI) Drops 17.7% on $79,726 of Liquidity, Too Thin to Absorb a Sizeable Sell
Volatility Event
During the last hour, Alphabet Inu (AGI) traded between $0.0009298 and a lower threshold that reflects a significant drop, with a turnover of $79,726. This price movement indicates a lack of orderliness, as the liquidity available was insufficient to absorb larger sell orders, contributing to the 17.7% decline.
- Liquidity depth: $79,726
- Pair maturity: 1.9 days
What The Risk Data Shows
The strongest contributor to the risk assessment is liquidity depth: $79,726 of liquidity. Workable for small positions, but larger orders will move the price against you. The pair is 1.9 days old — past the riskiest window but still young. 24h volume is 6.5x liquidity — active trading relative to pool depth. The overall risk band is Moderate.
Trading Conditions
In the last hour, there were 171 buy transactions and 148 sell transactions, indicating a roughly balanced order flow. This balance suggests that market participants are actively trading without a strong bias toward buying or selling.
Liquidity Context
The raw liquidity figure is $79,726, which implies that the market depth is limited. This lack of depth can lead to increased price volatility during larger trades.
Why This Was Flagged
- Price moved 17.7% in one hour (threshold: 15%)
- One-hour volume of $39,260 (threshold: $25,000)
- 319 trades in the last hour (threshold: 100)
- $79,726 of liquidity (threshold: $50,000)
- $899,780 market cap (threshold: $250,000)
- Trading pair 45.5 hours old (threshold: 15 minutes)
Risk Note
This article does not constitute financial advice.