Rich Debt (RICHDEBT) Rose 13.0% as Volume Runs 11.7x Its Liquidity, a Pattern Consistent With Wash Trading
Price Action
During the last hour, Rich Debt (RICHDEBT) traded between a low of $0.00469 and a high of $0.005305, with a trading volume of approximately $42,213. This level of trading activity indicates a significant interest in the asset, as the price rose by 13.0% during this period.
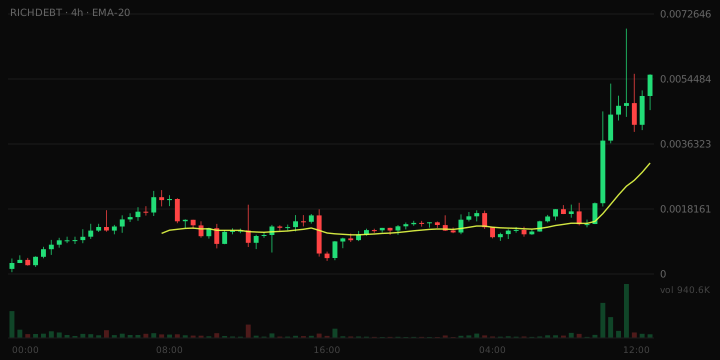
- Volume vs liquidity: 11.7x
What The Risk Data Shows
The strongest contributor to the risk assessment is that 24h volume is 11.7x liquidity — active trading relative to pool depth. Order flow balance indicates that 54% of the last hour's 393 transactions were sells, roughly balanced. The liquidity depth stands at $215,787, adequate for ordinary position sizes, though not deep. The overall risk band is classified as Moderate.
Trading Activity
In the last hour, there were 179 buys and 214 sells, resulting in a sell-to-buy ratio of approximately 1.2.
Market Snapshot
- Price (USD): $0.005305
- Liquidity (USD): $215,786.52
- Market Cap (USD): $5,221,783.00
- 1h Price Change: 12.96%
- 24h Volume (USD): $2,519,354.33
- Transactions (Buys): 179
- Transactions (Sells): 214
- Pair Age (Days): 13.5
Why This Was Flagged
- Price moved 13.0% in one hour (threshold: 15%)
- One-hour volume of $42,213 (threshold: $25,000)
- 393 trades in the last hour (threshold: 100)
- $215,787 of liquidity (threshold: $50,000)
- $5,221,783 market cap (threshold: $250,000)
- Trading pair 13 days old (threshold: 15 minutes)
Risk Note
This article does not constitute financial advice.