BTC$77,213▼ 0.39%
ETH$2,116▼ 0.78%
SOL$85.65▲ 0.78%
HYPE$57.73▲ 15.29%
XRP$1.36▼ 0.53%
BNB$649.20▲ 0.73%
DOGE$0.1045▲ 0.50%
AVAX$9.31▲ 0.70%
LINK$9.58▼ 0.12%
TAO$278.80▲ 5.59%
ZEC$661.59▲ 13.74%
NEAR$1.76▲ 7.73%
BTC$77,213▼ 0.39%
ETH$2,116▼ 0.78%
SOL$85.65▲ 0.78%
HYPE$57.73▲ 15.29%
XRP$1.36▼ 0.53%
BNB$649.20▲ 0.73%
DOGE$0.1045▲ 0.50%
AVAX$9.31▲ 0.70%
LINK$9.58▼ 0.12%
TAO$278.80▲ 5.59%
ZEC$661.59▲ 13.74%
NEAR$1.76▲ 7.73%
RSS
Risk Alert· Risk Alert ·

NECTAR (NECTAR) Records Elevated Volume Relative to Market Cap on Bsc

Risk Overview

The current risk level for NECTAR is elevated, driven primarily by its trading volume relative to liquidity. This situation suggests potential vulnerabilities in market stability and participant behavior.
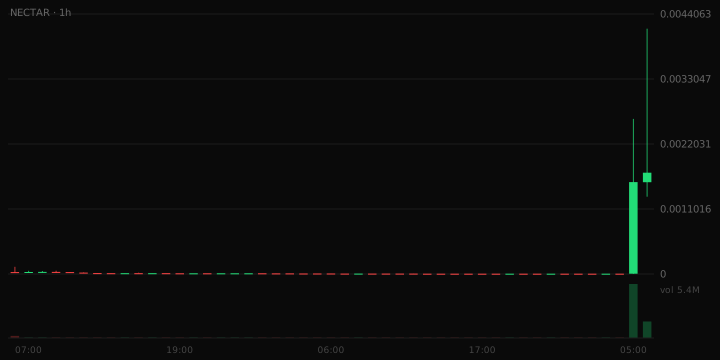
NECTAR price chart, 47 candles to Sep 15, 2026
TA · Price mid-range · 24h +22342% on $7.4M vol · 24h flow 45% buy / 55% sell · liquidity $154.7k · pool 46h old
Snapshot captured · View live chart →
Scalper risk score 55/100 Elevated
Elevated risk (55/100). The strongest contributor is volume vs liquidity: 24h volume is 47.7x the pool's liquidity. The same liquidity is being turned over repeatedly, which can indicate wash trading or bot activity. Assessed on 7 of 8 components; liquidity lock unavailable.
Market readThe pool turns over 47.7 times a day — among the most actively traded relative to its depth, with continuous flow on both sides.
  • Volume vs liquidity: 47.7x
  • Pair maturity: 1.9 days
7 of 8 components assessed · partial confidence · GoPlus
Full risk assessment and coverage for NECTAR →

Liquidity Assessment

The liquidity figure for NECTAR stands at $154,679. Liquidity is 9.7% of market cap, close to the 6.7% typical at this size. The same liquidity is being turned over repeatedly, which can indicate wash trading or bot activity.

Volume Assessment

The 24-hour trading volume for NECTAR is reported at $7,382,984. This volume is 47.7x the pool's liquidity, indicating a significant imbalance that may affect trading conditions.

Trading Behaviour

In the last hour, there were 8,455 buys and 9,605 sells, resulting in a sell/buy ratio of approximately 53%.

Risk Note

This analysis does not constitute financial advice.