Suica Rabbit (うさぎ) Drops 23.5% as Volume Runs 16.4x Its Liquidity, a Pattern Consistent With Wash Trading
Volatility Event
Suica Rabbit traded between $0.002884 and a low of $0.002204 during the hour, with a turnover of approximately $81,682. This indicates a significant price movement that is orderly in terms of transaction volume, as the trading activity was relatively concentrated.
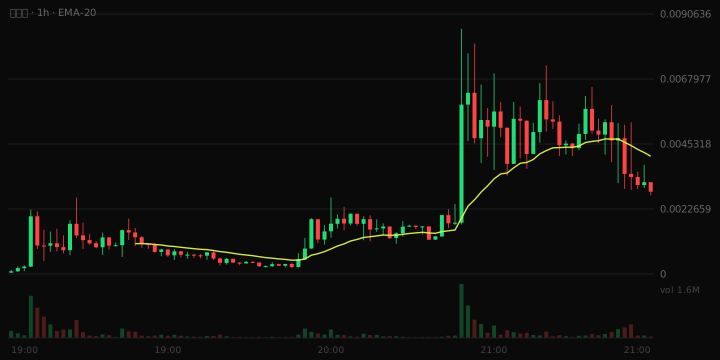
- Volume vs liquidity: 16.4x
What The Risk Data Shows
24h volume is 16.4x the pool's liquidity. The same liquidity is being turned over repeatedly, which can indicate wash trading or bot activity. The overall risk band is Moderate.
Trading Conditions
In the last hour, there were 213 buys and 127 sells, indicating a buy-side leaning with 37% of the transactions being sells. This balance suggests a slight preference for selling despite the overall trading volume.
Liquidity Context
The liquidity figure stands at $200,539, which is adequate for ordinary position sizes but not deep. This depth implies that larger trades could significantly impact the price.
Why This Was Flagged
- Price moved 23.5% in one hour (threshold: 15%)
- One-hour volume of $81,682 (threshold: $25,000)
- 340 trades in the last hour (threshold: 100)
- $200,539 of liquidity (threshold: $50,000)
- $2,884,381 market cap (threshold: $250,000)
- Trading pair 4 days old (threshold: 15 minutes)
Risk Note
This article does not constitute financial advice.