This token's liquidity has fallen substantially since publication, to approximately $7,809. That is down 85% from the $50,871 reported when this article was published. The figures below describe conditions at the time of writing.
ZOrdinals.fun (ZORDI) Records Elevated Volume Relative to Market Cap on Robinhood
Risk Overview
The current risk level for zOrdinals.fun (ZORDI) is elevated, primarily driven by significant trading volume relative to liquidity. This structural condition suggests potential instability in the trading environment.
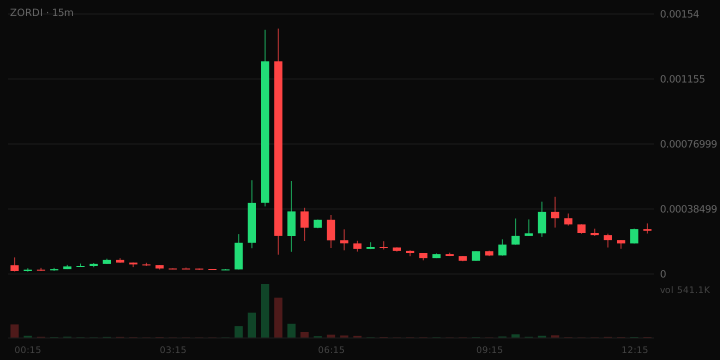
- Volume vs liquidity: 41.8x
- Pair maturity: 12.1 hours
- Liquidity depth: $50,871
Liquidity Assessment
The liquidity figure stands at $50,871. Liquidity is 17.0% of market cap, close to the 17.8% typical at this size. This liquidity is workable for small positions, but larger orders will move the price against you.
Volume Assessment
The 24-hour trading volume is $2,124,321. The 24h volume is 41.8x the pool's liquidity. The same liquidity is being turned over repeatedly, which can indicate wash trading or bot activity.
Trading Behaviour
In the last hour, there were 114 buys and 83 sells, resulting in a buy/sell ratio of approximately 1.37. Transaction-level buy/sell data was not available.
Risk Note
This analysis does not constitute financial advice.