Debtcoin (DEBTCOIN) Fell 28.9% on a Pool Only 1.2 Days Old, Before Any Trading History Exists
Volatility Event
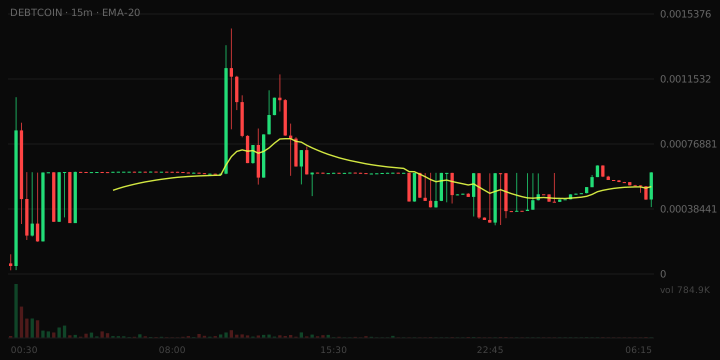
During the last hour, Debtcoin (DEBTCOIN) traded between $0.0003802 and a lower price point, with a turnover of $27,120. This price movement, which resulted in a 28.9% drop, occurred in a trading pool that is only 1.2 days old, indicating a relatively untested market environment.
- Pair maturity: 1.2 days
- Volume vs liquidity: 9.2x
What The Risk Data Shows
The pair is 1.2 days old — past the riskiest window but still young. 24h volume is 9.2x liquidity — active trading relative to pool depth. $167,165 of liquidity. Adequate for ordinary position sizes, though not deep. The overall risk band is Moderate.
Trading Conditions
In the last hour, there were 80 buys and 73 sells, indicating a roughly balanced order flow. This balance suggests that the market is experiencing active participation from both buyers and sellers.
Liquidity Context
The liquidity figure stands at $167,165, which implies that it is adequate for ordinary position sizes but not particularly deep. This liquidity level is above the typical threshold for this market cap size.
Why This Was Flagged
- Price moved 28.9% in one hour (threshold: 15%)
- One-hour volume of $27,120 (threshold: $25,000)
- 153 trades in the last hour (threshold: 100)
- $167,165 of liquidity (threshold: $50,000)
- $380,227 market cap (threshold: $250,000)
- Trading pair 29.7 hours old (threshold: 15 minutes)
Risk Note
This article does not constitute financial advice.