This token no longer has a tradeable liquidity pool. That is down 100% from the $154,159 reported when this article was published. The figures below describe conditions at the time of writing and do not reflect the token's current state.
Collective Evidence of Zero-Days (CEZ) Slides 22.3%, With No Elevated Risk Indicators Detected
Volatility Event
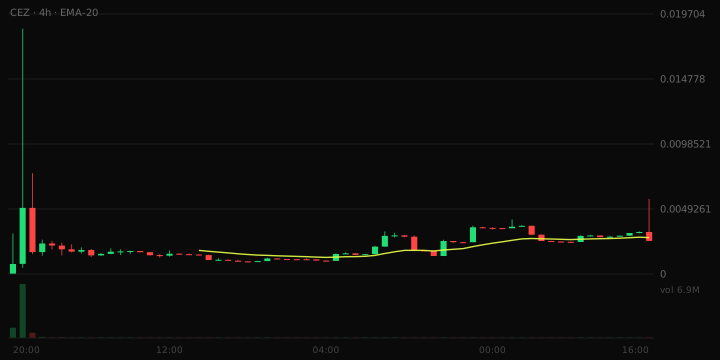
During the last hour, the price of Collective Evidence of Zero-Days (CEZ) traded between $0.002505 and $0.001949, with a turnover of approximately $95,872. This indicates a significant price movement of 22.3%, reflecting a relatively orderly market despite the volatility, as evidenced by the number of trades.
What The Risk Data Shows
The first finding indicates that there is $154,159 of liquidity, which is adequate for ordinary position sizes, though not deep. Liquidity is 6.2% of market cap, close to the 5.1% typical at this size. Additionally, 44% of the last hour's 554 transactions were sells, suggesting a roughly balanced order flow. Overall, the risk band is categorized as Moderate.
Trading Conditions
In the last hour, there were 309 buys and 245 sells. This balance indicates a relatively stable trading environment despite the recent price drop.
Liquidity Context
The raw liquidity figure stands at $154,159, which implies adequate depth for ordinary trading activities. This level of liquidity supports typical position sizes but may not accommodate larger trades without potential slippage.
Why This Was Flagged
- Price moved 22.3% in one hour (threshold: 15%)
- One-hour volume of $95,872 (threshold: $25,000)
- 554 trades in the last hour (threshold: 100)
- $154,159 of liquidity (threshold: $50,000)
- $2,500,532 market cap (threshold: $250,000)
- Trading pair 11 days old (threshold: 15 minutes)
Risk Note
This article is for informational purposes only and does not constitute financial advice.