This token no longer has a tradeable liquidity pool. That is down 100% from the $487,743 reported when this article was published. The figures below describe conditions at the time of writing and do not reflect the token's current state.
Copper Inu (COPPERINU) Fell 17.8% as Volume Runs 17.6x Its Liquidity, a Pattern Consistent With Wash Trading
Volatility Event
Copper Inu (COPPERINU) experienced a notable price movement, trading between $0.01712 and a peak of $0.02085, with a total turnover of approximately $579,695 in the last hour. This drop of 17.8% occurred within a volatile trading environment, indicating a significant level of activity but also raising questions about the nature of the trades.
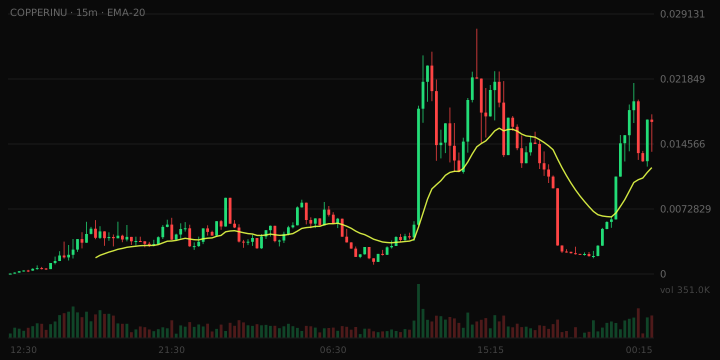
- Volume vs liquidity: 17.6x
- Pair maturity: 1.5 days
What The Risk Data Shows
24h volume is 17.6x the pool's liquidity. The same liquidity is being turned over repeatedly, which can indicate wash trading or bot activity. The overall risk band is Moderate.
Trading Conditions
In the last hour, there were 181 buy transactions and 70 sell transactions, indicating a buy-side leaning in the order flow. This balance suggests that despite the price drop, buying interest remains relatively strong.
Liquidity Context
The liquidity figure stands at $487,743, which is deep enough to absorb orders of typical size. This depth implies that while the market is active, the liquidity may not be sufficient for larger trades without impacting the price.
Why This Was Flagged
- Price moved 17.8% in one hour (threshold: 15%)
- One-hour volume of $579,695 (threshold: $25,000)
- 251 trades in the last hour (threshold: 100)
- $487,743 of liquidity (threshold: $50,000)
- $17,044,249 market cap (threshold: $250,000)
- Trading pair 35.8 hours old (threshold: 15 minutes)
Risk Note
This article does not constitute financial advice.