Mufasa (MUFASA) Has $9,370 of Liquidity Left Since We Covered It
What Happened
Mufasa's liquidity has decreased significantly, now standing at $9,369.84 compared to $52,889 when this site last covered it. This represents an 82.3% decline in liquidity, indicating a severe reduction in available funds for trading.
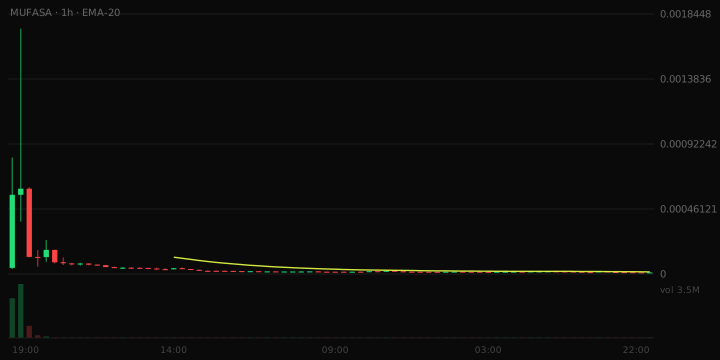
Liquidity measured $9,370 against $52,889 at coverage — down 82.3%. Measured against Mufasa (MUFASA) Records Elevated Volume Relative to Market Cap on Solana.
- Volume vs liquidity126.1xBorne outFlagged because turnover far above pool size meant exits would move the price.
- Pair maturity2.0 hoursBorne outFlagged because a pair this new had no trading history to stand on.
- Liquidity depth$52,889Borne outFlagged because a pool this thin would not absorb exits.
- Team identity, track record, and off-chain commitments
- Whether locked liquidity unlocks soon — only the current lock state is read
- Coordinated wallets that spread supply to look decentralised
- Social-media manipulation and paid promotion
- Anything in a contract's logic beyond the standard checks performed
This is one token measured against its own coverage. It is not evidence the score is predictive — a token failing does not prove the coverage was right, and one surviving does not prove it was wrong. These follow-ups are only written when a pool has collapsed, so flags will tend to read as borne out here; that is a property of which tokens get a follow-up, not a measure of how often the model is right. The corpus-wide test, covering every token including those that survived, is on the track record. Not financial advice.
What We Said At The Time
In the original coverage published on August 27, 2026, titled "Mufasa (MUFASA) Records Elevated Volume Relative to Market Cap on Solana," the token was assessed with an elevated risk band and a risk score of 60. The findings highlighted concerns regarding the liquidity situation relative to its market cap.
What This Shows
The current liquidity levels demonstrate a significant deterioration in the conditions previously flagged. The drastic drop in liquidity indicates a potential liquidity crisis, which aligns with the elevated risk assessment noted in the earlier coverage.
Current State
- Liquidity now: $9,369.84
- Liquidity at publication: $52,889.00
Risk Note
This article does not constitute financial advice.